![[音频分析器插件]Excite Audio VISION 4X v1.0.1 [MacOS](42.1MB)插图](https://www.midivst.com/wp-content/uploads/2022/12/1671103641_2339201456.webp "[音频分析器插件]Excite Audio VISION 4X v1.0.1 [MacOS](42.1MB)插图")
MORiA | December, 15 | AU | VST | VST3 | STANDALONE | 42.1MB
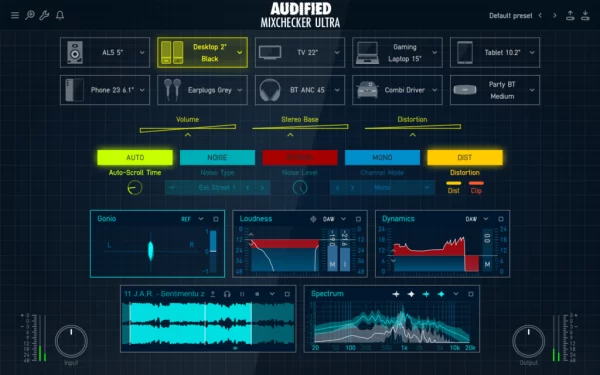
Excite Audio和NOISIA联手,合作推出了VISION 4X这款全新的音频分析器。VISION 4X结合了四种可同时运作的实时可视化分析工具,分别为频谱图、频谱响度条形图、波形图和相位相关表。用户可以自行调整每个分析仪的窗口大小,还可以根据自己的工作流程来缩放插件的UI。
VISION 4X可以完美同步DAW,用户可以根据工程自定义分析时间范围。VISION 4X机可以连续完整地运行,也可以循环运行一个片段并叠加起来。如果你想专注于某一个声音元素,可以将插件设置为收到MIDI信号时重新触发,例如底鼓这种元素。
VISION 4X功能:
- 带有4个实时、高清视觉分析仪
- 可定制、可调整布局大小
- 10种频谱色彩,专为最大信息密度而设计
- 可自定义频率范围和dB范围
- 提供更深入的冻结显示和放大功能
- Map Curve/Tone Bias可将频谱图聚焦在特定频率上。
- 可将分析时间范围同步DAW
- 提供两种显示模式:连续可视化和叠加可视化
- 提供MIDI重新触发功能
- 信息栏显示音高、音符、dB和时间信息
- 提供立体声/左/右/中/侧模式
- 内置由Noisia设计的预设
原文:
Developed in partnership with electronic music trio Noisia, VISION 4X gives you the insights you need to prepare your tracks ready for competition with today’s top mixes, and the clarity to make the right mixing decisions with confidence – however modest your setup. Get a deeper understanding of your sound than ever before with VISION 4X, a powerful visual analysis plugin with maximum precision.
See Your Sound
Get a deeper understanding of your sound than ever before with VISION 4X,
a powerful visual analysis plugin with maximum precision. Developed in partnership with electronic music trio Noisia, VISION 4X gives you the insights you need to prepare your tracks ready for competition with today’s top mixes, and the clarity to make the right mixing decisions with confidence – however modest your setup.
Four Visual Dimensions
VISION 4X combines four custom-built visual analysis tools that work simultaneously in real-time, including a spectrogram, bar graph, waveform and phase correlation meter. Each analyser is displayed in its own resizable window, allowing you to scale the plugin’s UI to suit your workflow.
Customisable Timeframe
Perfectly sync VISION 4X to your DAW and customise the analysis timeframe for any project. Choose to run the analysers continuously, or loop a section of time and let them overlay. Alternatively, if you want to hone in on a particular sound, set the plugin to retrigger whenever a MIDI signal is received – ideal for comparing kicks in real-time
Spectrogram
VISION 4X’s powerful spectrogram provides enhanced low-end resolution, offering access to more information about the frequencies in your mix. Freeze the visualiser for a snapshot of your sound, zoom in to get a close-up of the frequency spectrum, and navigate the display to discover details that otherwise could be missed.
Colour Maps
Customise the spectrogram’s display with ten Colour Maps to choose from, each one specifically selected for maximum information density when analysing sound. Brightness can be biased towards the low or high frequencies using Map Bias, and Range Hz and Range Db sliders give you total control over the frequency and volume range of the display.
Bar Graph
VISION 4X’s bar graph is a fully customisable spectrum analyser that can highlight the gain levels of the sustained frequencies in your sound. Choose to get an overview of how frequencies are distributed in your mix, or an intricate analysis, by varying the number of bars shown in the graph. The Speed of the bar graph’s movement can be adjusted to run alongside your track however you see fit, and you can easily spot peak levels using the Peak Hold sustain control.
VISION 4X also has a Spectrum Highlight feature that indicates resonant frequencies, which can be tailored for sensitivity and matched with the colour coding of the spectrogram.
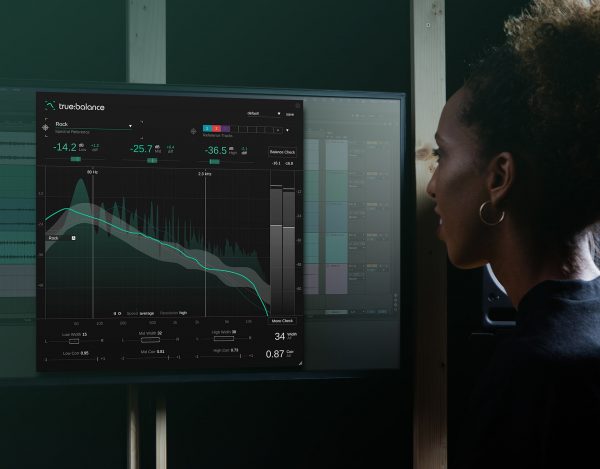
Understand and improve the balance of your mix by comparing it with reference curves from a range of genres, generated through an in-depth analysis of hundreds of tracks. Each reference curve has an average and a maximum value line, with overshooting clearly indicated in red – the perfect visual feedback tool for assurance in your mixing decisions.
Waveform
As well as the spectrogram and bar graph, VISION 4X features a waveform analyser that enables you to carefully inspect your sound source. Alongside the plugin's other visualisers, you can use the waveform analyser to magnify soundwaves and gain valuable pitch, volume and timing information, with an intuitive colour-coded display.
The waveform analyser is accompanied by VU and RMS metering tools, allowing you to assess volume and loudness levels with ease. Keep track of the headroom for your mix with an overshoot highlighting feature that informs you when levels are going above 0dB.
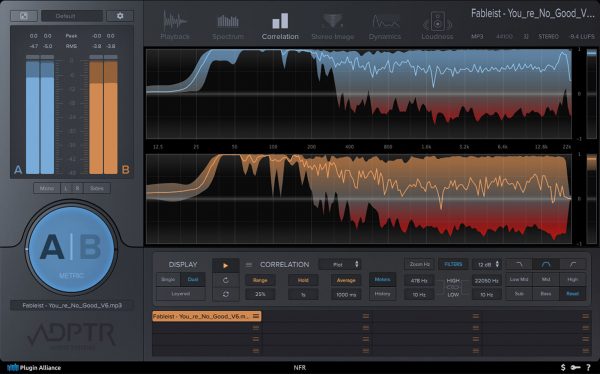
Phase Correlation Meter
Explore the stereo dimensions of your sound with VISION 4X’s phase correlation meter, a tool that gives you an impression of your stereo spread and helps you to determine phase differences between the left and right channels. Any phase issues are clearly displayed along the centre line, helping you to maintain alignment and prevent any loss of audio when you’re converting to mono.